MetaTrader 5 Help →
Price Charts, Technical and Fundamental Analysis →
Analytical Objects →
Graphical Objects →
Graph
Graph
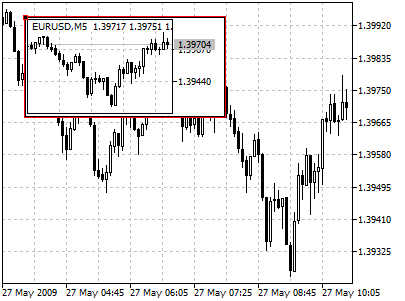
This object is used for adding a chart of any security into the chart window, which allows tracing the price dynamics of several symbols at the same time. The object is anchored to a chart window and does not move when the chart is scrolled.
When applied, this object inherits the current properties of a chart, to which it is applied. |

Controls
The object is moved using the anchor point located on one of object sides or corners.
Parameters
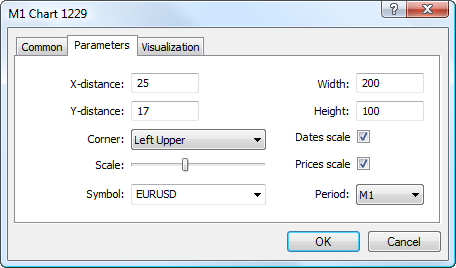
There are the following parameters of the "Chart" object:

- X-distance — distance in pixels from the anchor corner of the chart window till the control point of the object along the time axis;
- Y-distance — distance in pixels from the anchor corner of the chart window till the control point of the object along the price axis;
- Width — width of the chart window;
- Height — height of the chart window;
- Corner — one of the corners of the chart window, from which distances along X and Y axes will be set;
- Scale — chart scale adjusted using lever;
- Dates scale — display or not to display the time scale in the chart;
- Prices scale — display or not to display the price scale in the chart;
- Symbol — selecting a symbol for the chart;
- Period — selecting the chart period.
Common parameters of object are described in a separate section.