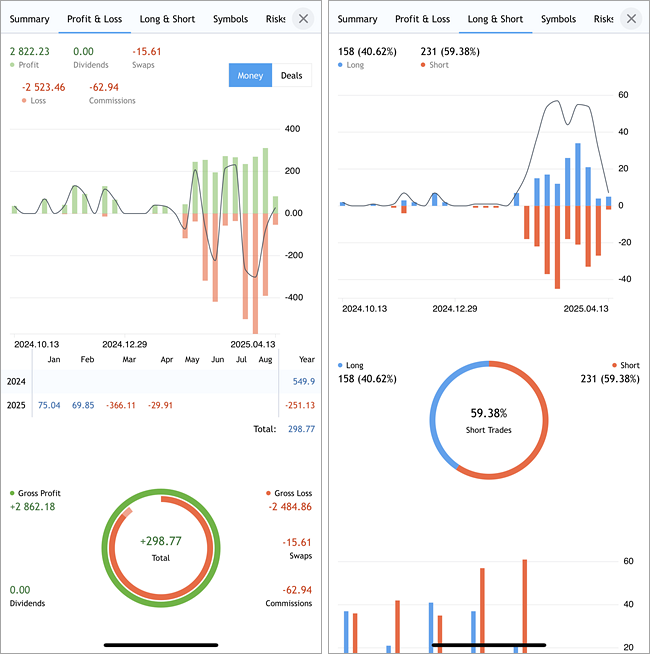
Trading Report
The report represents trading results in a convenient visual format. It assists in evaluating trading performance, optimizing portfolios and finding methods to achieve lower risks along with improved trading stability. To analyze your strategy, go to the history section and click on the period selection icon. Next, select the period and click "Create a trade report".

The report is divided into tabs, each providing aggregated information:
- Summary – an overview of trading over time: overall profit and loss metrics, deposit and withdrawal amounts, balance, growth and dividends graphs, and other trading results.
- Profit/Lost – data on profitable and losing trades. The parameter is divided by types of trading (manual, algorithmic and copying trades). The results can be analyzed in terms of trades or money by months and years.
- Long/Short – dynamic ratio of buy and sell operations at specified periods of time, as well as Buy and Sell profitability.
- Symbols – analysis of trades by financial instruments. You will see here which symbols you earn or lose on, how often you trade them, graphs of trades and monetary volumes for them.
- Risks – key risk characteristics of your strategy: drawdown and deposit load graphs, and the ratio of profitable and losing trades.

To save the report file or share it via messenger, email, or social media, scroll through all the report tabs to the end and tap ![]() . Next, select "Save as PDF". This will open your device's standard file handling menu.
. Next, select "Save as PDF". This will open your device's standard file handling menu.
For recommendations on how to use the report, refer to the article "New MetaTrader report: 5 most important trading metrics". A full description of all report parameters is available in the desktop platform's Help section.
|