2 August 2024
Quotes service: Real-time prices and interactive charts for technical analysis
The Quotes service provides up-to-date data on financial instruments. Monitor real-time prices to stay informed about global market changes and make accurate trading decisions
The Quotes
service provides up-to-date data on financial instruments. Monitor
real-time prices to stay informed about global market changes and make
accurate trading decisions. We offer:
- Real-time prices for currencies, cryptocurrencies, metals, indices, and commodities.
- Interactive charts to analyze historical quotes and identify trends for each instrument.
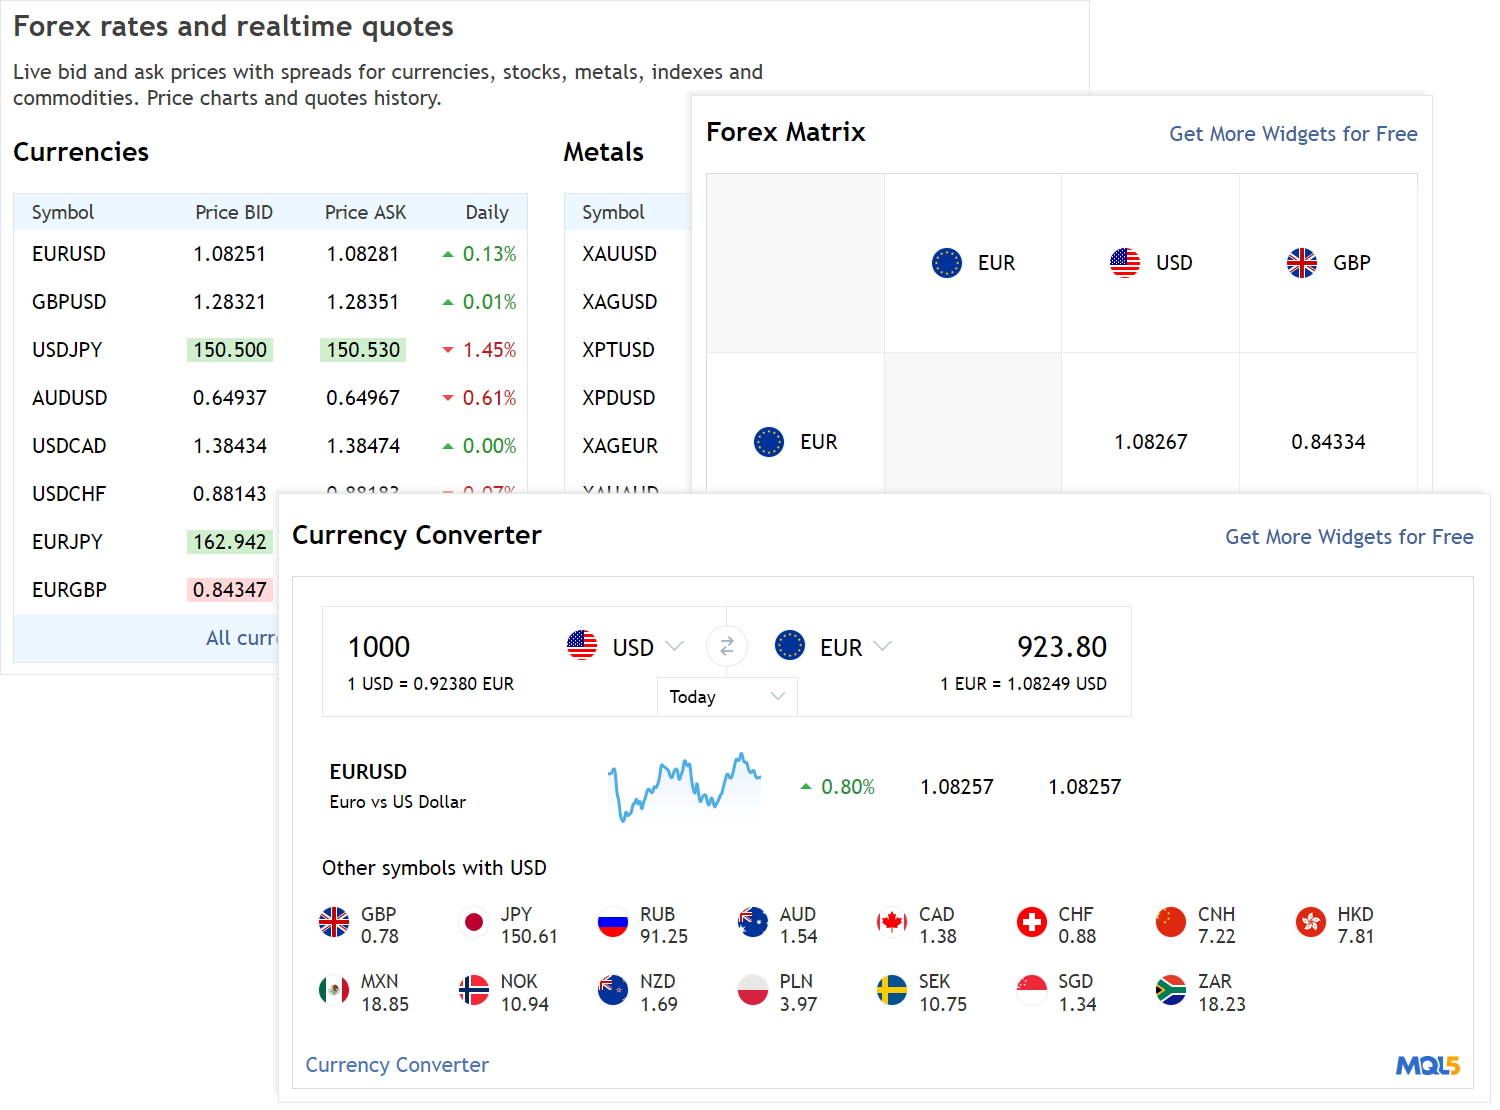
- An exchange rate showcase of the most popular currencies to view the overall financial landscape across different regions.
- Currency Converter for quick conversion between various currencies.
Market Watch
The Market Watch
section features buy and sell prices for all instruments, as well as
price changes over the past 24 hours. The Price Matrix allows you to
track multiple currency pairs on one screen, while the converter enables
quick currency conversions.

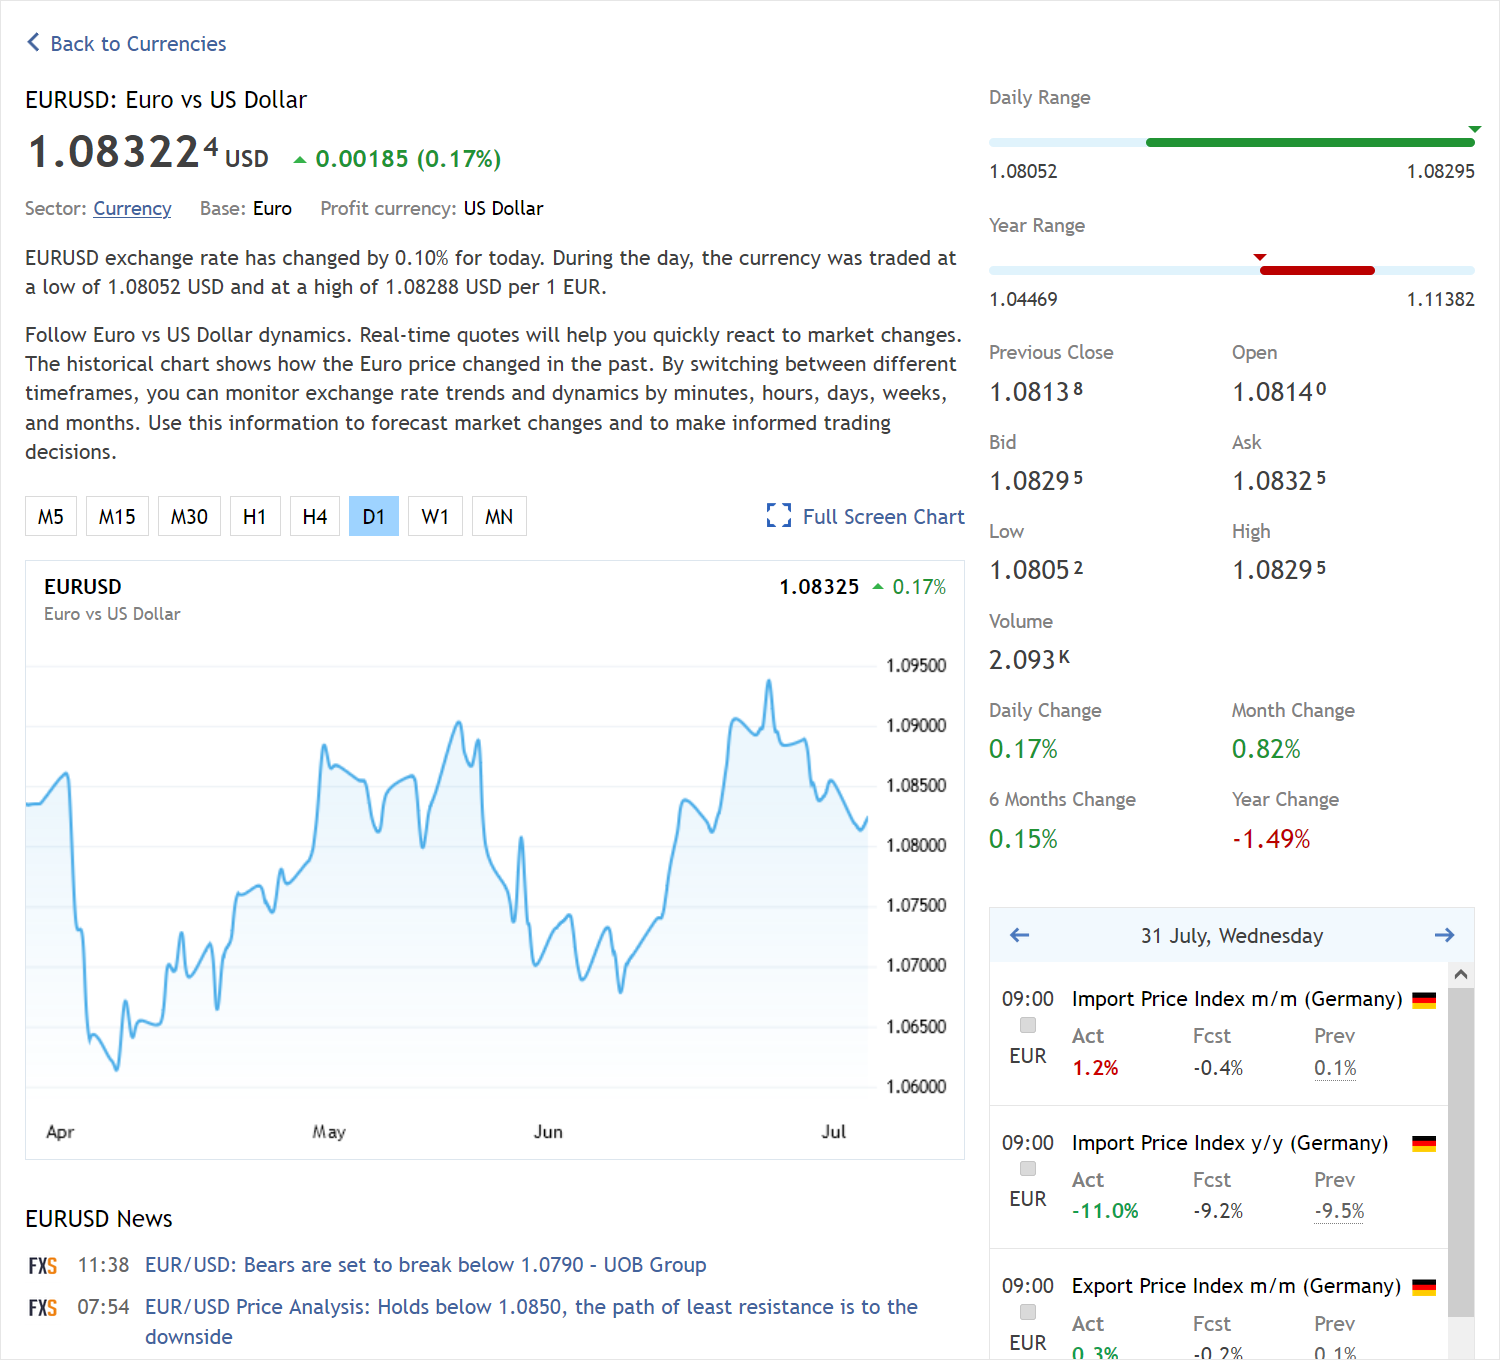
Detailed symbol information
Visit any instrument's page for detailed information:
- Symbol description, quotes, and daily changes in points and percentages.
- Mini-chart with the ability to switch timeframes. For more detailed chart data, expand it to full screen.
- Daily and annual ranges. The daily range shows Low, High, Open, and Current prices. The yearly range displays the High and Low values, as well as the last-year and current prices.
- Current statistics with the latest market Open, Close, Bid, Ask, Low, and High prices, along with volumes.
- Daily, monthly, semi-annual, and annual price changes.
- Economic Calendar showing significant upcoming and past events that may affect the symbol.
- A selection of news related to the selected instrument.
- A selection of signals to trade the selected currency pair.

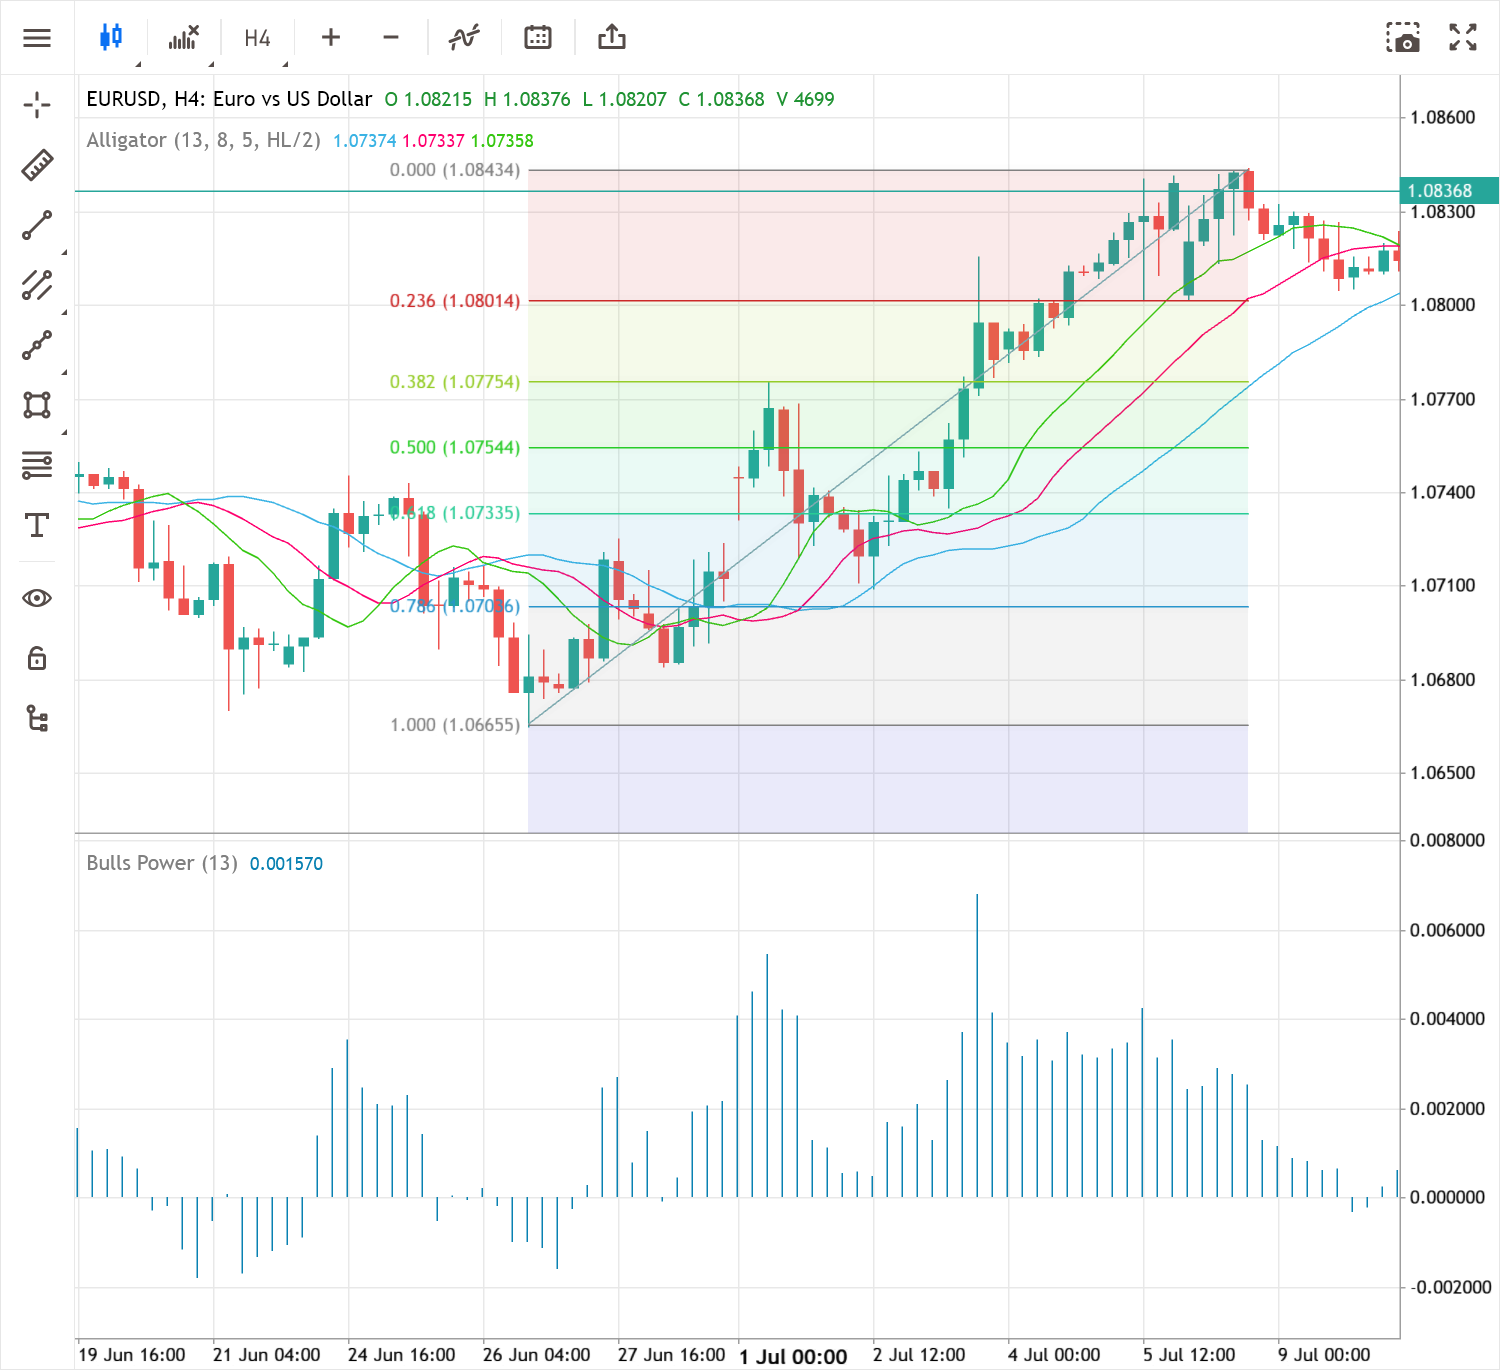
Interactive charts
Monitor the market and identify trends for trading decisions using interactive charts.
Numerous graphical objects and indicators are available for technical
analysis. Click "Share" in the top menu to share your trading ideas with
colleagues. You will receive a direct link to the chart or HTML code to
embed on a website or blog. All your chart changes will be saved, and
the recipient can adjust them. This is convenient for team discussions
or visual demonstrations.

Widgets
Install financial widgets to your website or blog to make it more engaging for visitors. Data is updated in real-time, with no advertisements displayed. Available features:
- Mini-chart to display data for selected instruments
- Ticker list to show basic information for multiple symbols
- Symbol table with bid and ask prices and daily change mini-charts
- Currency Converter
- Forex Matrix
- Economic Calendar
Use the Quotes section to stay ahead of market changes. Detailed
information on financial instruments and interactive charts will assist
in making accurate trading decisions.
- MQL5 Cloud Network: A technological breakthrough in trading strategy testing
- MetaTrader 5 Platform build 4410: Performance improvements
- MetaTrader 5 Platform build 4380: Performance improvements
- MetaTrader 5 Build 4350: More analytical objects in the Web platform and Welcome page in MetaEditor
- MetaQuotes to present its latest developments at the summit in South Africa